Suppose I have a small task-management app with two MCP tools:
tasks_search     Read matching tasks
task_mark_done   Complete one task after confirmation
I connect the app’s MCP server to Codex. I can now ask:
Find my open tasks tagged “onboarding” that are due this week.
Codex discovers the available tools, calls tasks_search, receives the result, and explains it to me. This is useful, but when something goes wrong I need more than the final answer. Did Codex call the expected tool? Did authentication pass? Was the tool slow? Did it return zero records, or did it fail?
Langfuse gives me that missing operational view.
The three separate parts
There are three systems in this example:
- Codex is the AI client. It decides when to call an MCP tool.
- My app owns the MCP endpoint, permissions, tools, and database.
- Langfuse receives safe telemetry from my app and displays traces.
They remain separate applications:
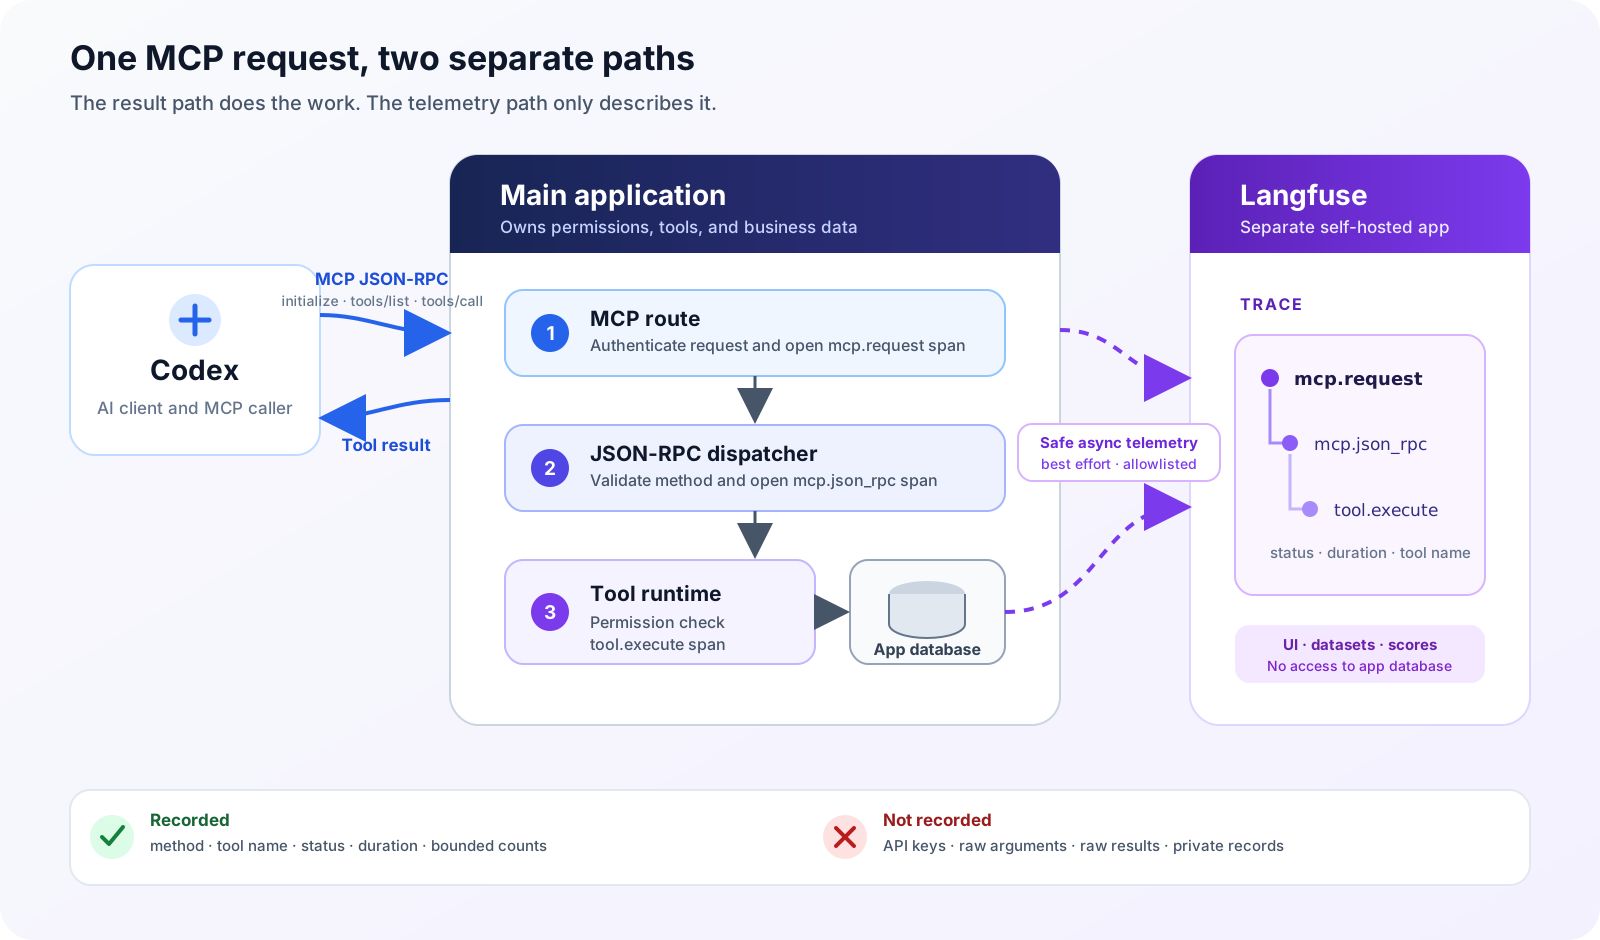
The MCP result returns to Codex. A separate, best-effort telemetry path sends only approved metadata to Langfuse.
Langfuse is not between Codex and my app. It does not proxy the request, call the tool, or read the app database. If Langfuse stops, the MCP request should still work.
There is another important limit: this app-side integration observes what reaches the MCP server. It can record the JSON-RPC method and tool execution, but it cannot automatically see my conversation or the model’s internal work inside Codex. If the app also runs its own model, I can instrument that model call as a separate generation.
What one request looks like
For the example question, the full loop is:
- Codex connects to the app’s MCP endpoint.
- Codex sends
initializeandtools/list. - Codex chooses
tasks_search. - The app authenticates the request and validates its JSON-RPC payload.
- The MCP runtime executes the read-only tool.
- The app returns the tool result to Codex.
- The app asynchronously exports safe observations to Langfuse.
- I open the trace and inspect status, timing, and tool metadata.
The trace can use a small hierarchy:
mcp.request
└── mcp.json_rpc
    └── tool.execute
Opening tool.execute might show:
{
  "toolName": "tasks_search",
  "surface": "mcp",
  "status": "success",
  "durationMs": 42,
  "resultCount": 3
}
It should not show the raw search query, task titles, task descriptions, user identity, API key, or complete tool result. The trace contains enough information to explain the execution without becoming a copy of application data.
This is the Langfuse vocabulary behind the structure:
- a trace is one complete request
- an observation or span is one timed step
- a generation is an observation for a model call
- a dataset is a reusable collection of test cases
- a score records whether an output met an expectation
Do I need to change any code?
The short answer is:
| Part | Change required? |
|---|---|
| Langfuse source code | No |
| Codex MCP usage | No |
| Existing tool business logic | Usually no |
| Main app server | Yes, add the SDK and observation boundaries |
| Cloud services | No for a local self-hosted pilot |
I do not add app-specific code to the Langfuse repository. I run the normal Langfuse stack and configure a project. The small code change belongs in my app because only the app knows where an MCP request starts, where a tool runs, and which metadata is safe.
Some frameworks have automatic Langfuse integrations. For a custom MCP server, I prefer manual observations at two shared boundaries: the MCP route and the common tool executor. That instruments every tool without editing each tool’s business logic.
A minimal local start
Langfuse’s open-source core can be self-hosted without using Langfuse Cloud. For a local pilot there is no Langfuse usage bill, although a real shared deployment still has compute, storage, backup, and maintenance costs.
First, start Langfuse from its own checkout:
docker compose up -d
docker compose ps
curl -fsS http://localhost:3000/api/public/ready
Open http://localhost:3000, create a project, and create that project’s public and secret keys. Keep them in the app’s untracked environment file:
LANGFUSE_ENABLED=1
LANGFUSE_PUBLIC_KEY=pk-lf-...
LANGFUSE_SECRET_KEY=sk-lf-...
LANGFUSE_BASE_URL=http://localhost:3000
LANGFUSE_ENABLED is an application kill switch, not a required Langfuse setting.
For a TypeScript server, the official SDK setup uses the tracing and OpenTelemetry packages:
pnpm add @langfuse/tracing @langfuse/otel @opentelemetry/sdk-nodeThen initialize the exporter once in server-only code:
import { LangfuseSpanProcessor } from "@langfuse/otel";
import { NodeSDK } from "@opentelemetry/sdk-node";

const processor = new LangfuseSpanProcessor({
  publicKey: process.env.LANGFUSE_PUBLIC_KEY,
  secretKey: process.env.LANGFUSE_SECRET_KEY,
  baseUrl: process.env.LANGFUSE_BASE_URL,
  environment: "development",
  mediaUploadEnabled: false,
});

new NodeSDK({
  spanProcessors: [processor],
}).start();
Finally, wrap the shared MCP boundaries. The exact framework code differs, but the shape is simple:
import { startActiveObservation } from "@langfuse/tracing";

export async function handleMcp(request: Request) {
  return startActiveObservation(
    "mcp.request",
    async (observation) => {
      observation.update({
        metadata: { route: "/mcp", surface: "mcp" },
      });

      return dispatchJsonRpc(request);
    },
    { asType: "span" },
  );
}
The common tool executor creates the nested child:
export async function executeTool(name: string, args: unknown) {
  return startActiveObservation(
    "tool.execute",
    async (observation) => {
      const result = await toolRegistry[name](args);

      observation.update({
        metadata: {
          toolName: name,
          status: "success",
          resultCount: safeResultCount(result),
        },
      });

      return result;
    },
    { asType: "span" },
  );
}
Notice that args and result are used by the tool but are not sent to Langfuse. Production code should also record a safe error category, close streaming observations correctly, flush before short-lived scripts exit, and ensure telemetry initialization or export failure never causes the business operation to run twice.
The first smoke test
I start with synthetic tasks, never real user data:
itest-onboarding-1  Write welcome checklist  open
itest-onboarding-2  Review access guide      open
Then I ask Codex to search for the synthetic tag. In Langfuse I verify:
- one recent
mcp.requesttrace exists - it contains
mcp.json_rpcandtool.execute - the tool name, status, duration, and bounded result count are useful
- the API key, raw arguments, task content, and raw result are absent
- disabling Langfuse or stopping its containers does not break the MCP call
That last check matters. Observability should describe the application, not become a new requirement for using it.
From a trace to a repeatable evaluation
A trace helps debug one request. A dataset helps stop the same problem returning.
Suppose Codex later selects task_mark_done when I only asked it to search. I reproduce that behavior with synthetic tasks and add the request to a fixed evaluation dataset. Before changing the model, prompt, or tool descriptions, I save deterministic expectations:
expected tool: tasks_search
write operations: 0
confirmation required: false
result count: 2
The improvement loop becomes:
bad trace
→ synthetic reproduction
→ fixed dataset item
→ run current implementation
→ run candidate implementation
→ compare correctness, failures, and latency
Software checks should judge rules that software can know. An LLM judge may help score clarity, but it should not overrule permission checks, confirmation requirements, or database read-back.
The practical best-practice checklist
My starting checklist is short:
- instrument shared server boundaries, not every function
- keep trace names stable and low-cardinality
- use an allowlist for metadata
- never record secrets, raw MCP arguments, or raw tool results by default
- separate environments and use synthetic data for the first tests
- make telemetry best-effort and add a kill switch
- turn recurring failures into fixed dataset cases
- use deterministic evaluators before subjective model judging
- back up PostgreSQL, ClickHouse, and object storage if traces matter
Langfuse does not make an MCP integration safe by itself. The app still owns authentication, authorization, schema validation, confirmation, and tool behavior. What Langfuse adds is a readable history of those boundaries being exercised—and a path from one confusing failure to a test that can prevent it happening again.