For Warwick University module 910, Data analysis.
2. math back ground
- why frequency/rank for heavy tailed?
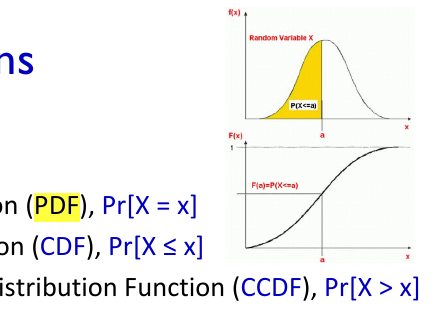
The frequency/rank plot because the CCDF is a monotonous function. Moreover, unlike the PDF function, the CCDF displays a significantly lower variability in the tail.
- independence: event and random variables
- HH and TT
- not independent because the mere occurrence of one would tell us for sure that the other can’t happen.
- HH and TT
- Conditional Probability
- Heavy-Tailed Distributions
roughly non-negligible probabilities at large values far to the right.
- CDF+CCDF=1
- Real Histograms
- log-log plot is also a great trick to visualize data spanning a wide range of data.
- Pareto Distribution
- Good (Enough) Method: Frequency/Rank Plot the sharp drop in variance in the tail is the fact hat the CCDF is a monotonous function
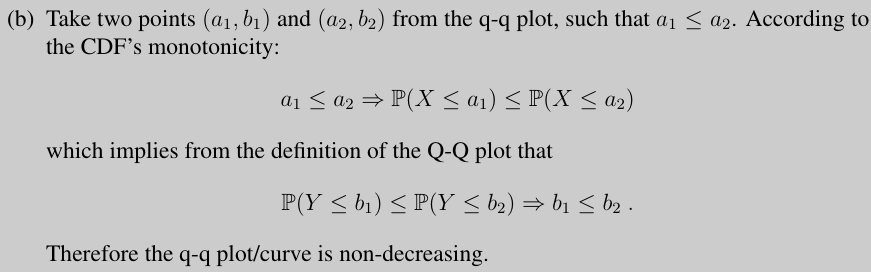
- the Q-Q curve is non-decreasing
3. statistics
- quantile-quantile plot
- Allows comparison of attributes of different cardinality
- Plot points corresponding to f-quantile of each attribute
- If close to line y=x, evidence for same distribution
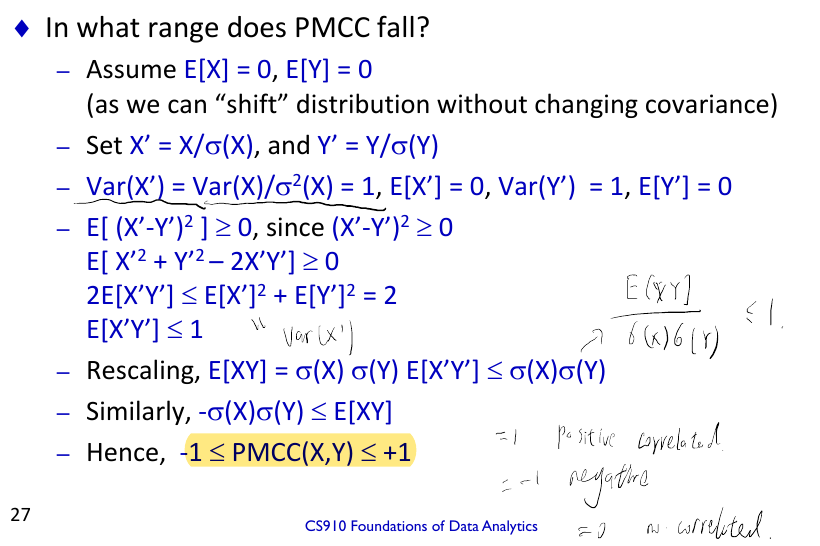
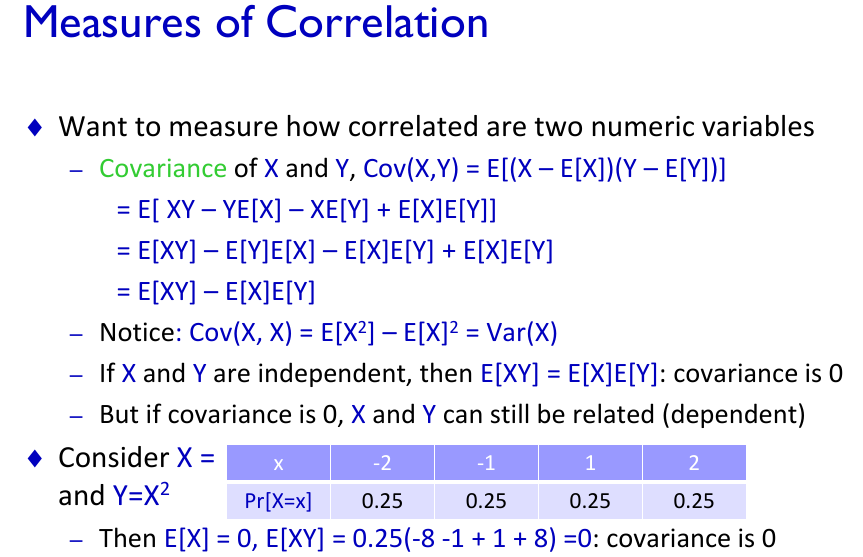
- PMCC = (E(XY)-EXEY)/($\sigma x \sigma y$) = cov(xy)/($\sigma x \sigma y$)
- pmcc between -1,1
- Measures linear dependence in terms of simple quantities
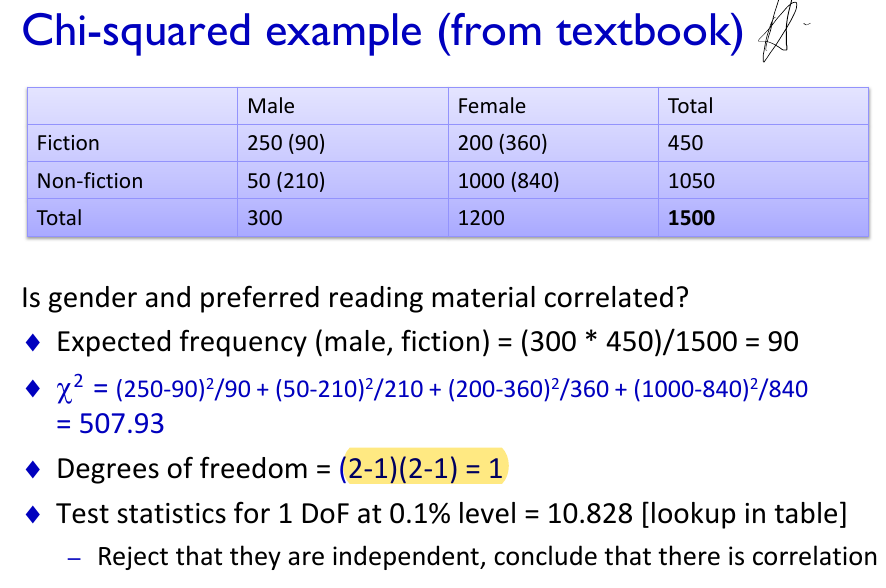 > table, correlated.
< table, no correlation.
> table, correlated.
< table, no correlation.
3.1 handle problems
- numeric data, ranges vastly different
- range scaling, to 0,1.
- statistical scaling, (x-u)/a
- ordered data: replace each point with its position in the ordering
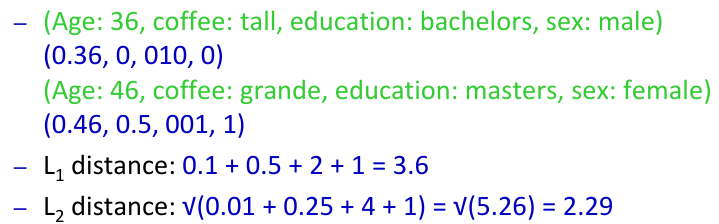
- mixed data: encode each dimension into the range 0,1. use Lp distance
- handle missing values
- drop the whole record
- fill in missing values manually
- as unknown, ensure can handle
- no ideal solution
- Noise, hard to tell. statistical tests
- Outliers: extreme values
- finding in numerica data
- sanity check, mean ,max, std dev
- visual, plot , far from rest
- rule based, set limits
- data based, declare if > 6
- categoric data
- visual, look at frequency statistics, low frequency
dealing outliers: delete, clip(change to max/min), treat as missing
- discretization: features have too many values
- binning, place data into bands
- use existing hierarchies in data
- random sampleing, stratifies, take samples from subsets
- feature selection
- principal components analysis
- greedy attribute selection
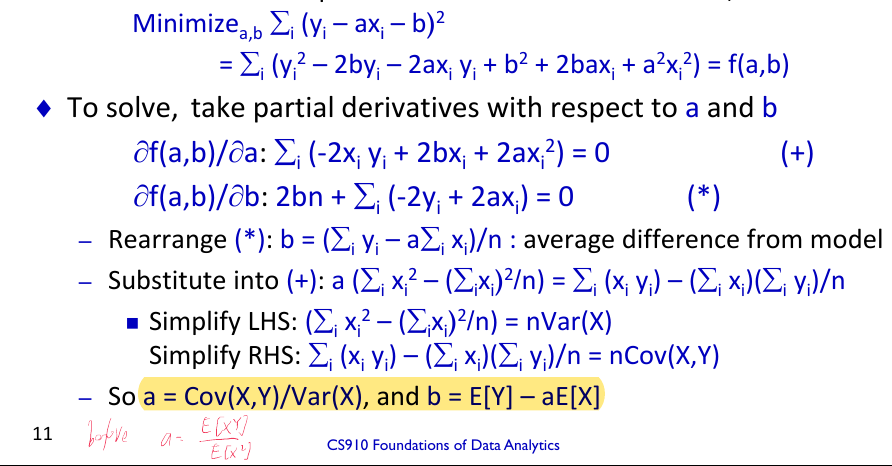
4.regression
- regression 4
- Assuming unbiased independent noise with bounded variance
- PMCC , Product-Moment Correlation Coefficient determines the quality of the linear regression between X and Y
- R2 = Cov2(X,Y) /(Var(X)Var(Y)) = PMCC^2
- measure the coefficient of determination, how much the model explains the variance in Y
- 1, good fit, 0 ,weak fit to the model
- Two perfectly correlated attributes can’t be used in regression
- Violates requirement of no linearly dependent columns
- Regularization can fix this: ensures matrix is non-singular
dealing with categoric attributes
- numerically encode categoric explanatory variables
- simple case: 0/1, include this new variable in the regression
- general categoric attributes, create a binary variable for each possibility
Regularization in regression: To handle the danger of overfitting the model of the data, include the parameters in the optimization
6. classification
measures
- precision : tp/(tp+fp)
- recall: tp/(tp+fn)
- F1 2precision*recall/(precision+recall)
- ROC: recall-y, fp-x(fp/(fp+tn))
k-fold cross validation
- Divide data into k equal pieces (folds)
- use k-1 for training, evaluate accuracy on 1 fold, repeat
Entropy H= -plog(p),
- information gain=H-Hsplit
- gain ratio = (Hx-Hsplit)/Hsplit
kappa
- higher is better
- compares accuracy to random guessing
- Po as the observed agreement between two labelers
- Pe is the agreement if both are labeling at random
- K = (Po-Pe)/(1-Pe)
pruning
- prepruning:add additional stopping conditions when building
- Postpruning: build full tree, then decide which branches to prune
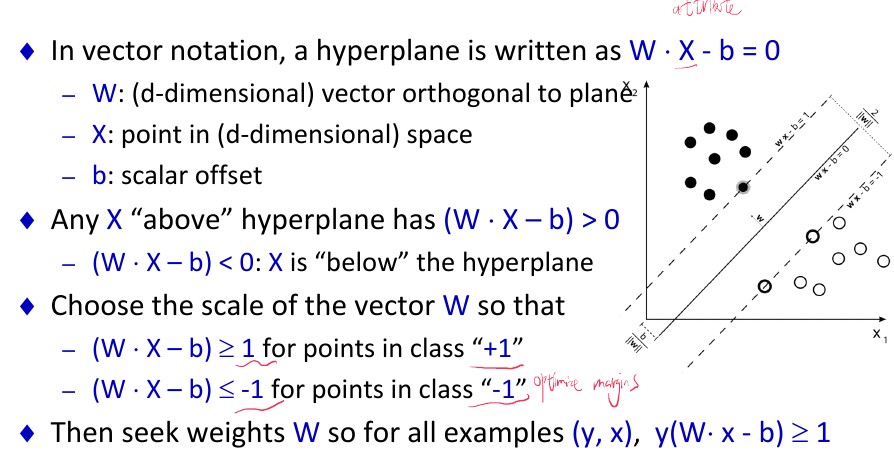
SVM
- assume data is linearly separable
- seeks the plane that maximizes the margin between the classes
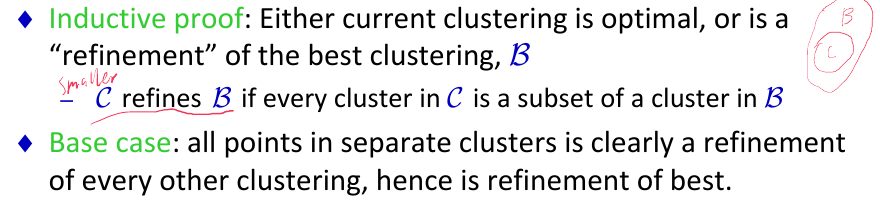
7. clustering
- k-center Furthest point for
minimize the max distance between pairs in same cluster
- 2-approximation
- asuume the furthest point to all center>2opt
- then the distances between all centers are also>2opt
- we have k+1 points with distances>2opt between every pair
- since each point has a center with distance < opt
- there exists a pair of points with same center, the distance is at most 2opt
- contradiction!
- 2-approximation
- k-medians minimize the average distance from each point to its closest centre
- k means Lloyd
minimize the sum of squared distance
- assign each point to its cloest center
- compute new centroid of each cluster, until no change
- Hierarchical agglomerative HAC
- merge closest pair of clusters
- single, complete, average link
- single: d(C1,C2) = min d(c1 in C1, c2 in C2)
- complete: d(C1,C2) = max d(c1 in C1, c2 in C2) max nodes between each cluster, then find the min
- avg
- Dc-Tc >= Db - Tb
- DBSCAN based on local density of data points
- Epsilon, the radius to search for neighbours
- MinPts, min start points to make one cluster
- density reachable .->.
- density connected .<-.->.
8. recommendation
- recommendation 8
- neighbourhood-based collaborative filtering
- item-based collaborative filtering
- matrix factoraization-singular value decomposition
- solving the optimization
- gradient descent
- least squares
- adding biases
- solving the optimization
9. social network analysis
social networks 9
- concept
- in-degree, out degree.
- distance
- diameter
- link prediction on graphs
- simplest: common neighbours will link
- weighting common neighbours
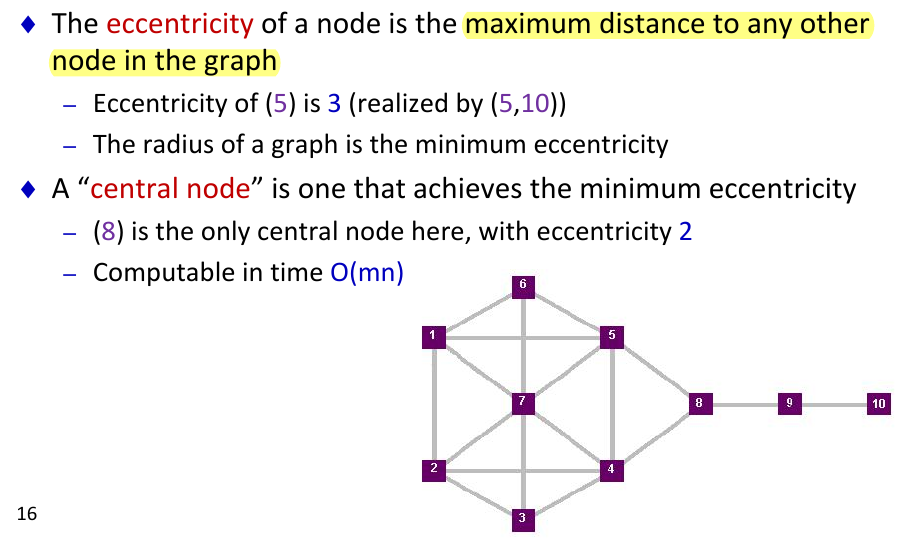
- finding important nodes
- graph centrality
- eccentrality
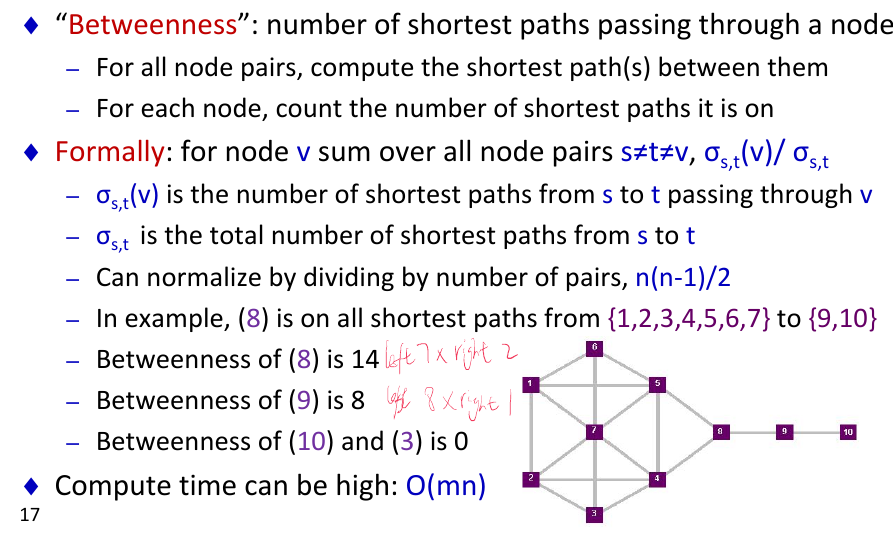
- betweenness centrality
- graph centrality
- pageRank
- eigenvector formulation
- r=Mr
- power iteration method
- random walk interpretation
- eigenvector formulation
- classification in social networks
- concept
clustering coefficient
- measures the fraction of triangles
- (number of triangles)/(number of pairs of common neighbours)
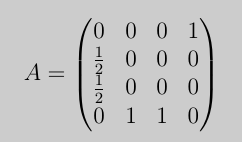
page-rank
here (1,2)(1,3)
- key shortcoming of simplified version?
The problem is the periodic behavior, meaning that PageRank cannot identify the most important web-page. One solution is to create a self-loop (e.g., (1, 1)), in which case the iterative procedure from (a) would be guaranteed to converge.
- main objective? how achieved?
PageRank computes the importance of web-pages. This is achieved by leveraging the transition matrix.